Australian motorcycle and OHV (Off Highway Vehicle) sales for the first nine months of this year have increased 8.3% over Covid-ravaged 2019.
According to official figures released by the Federal Chamber of Automotive Industries, 86,239 bikes were sold compared with 79,623 this time last year which was a 26.4% increase over 2019.
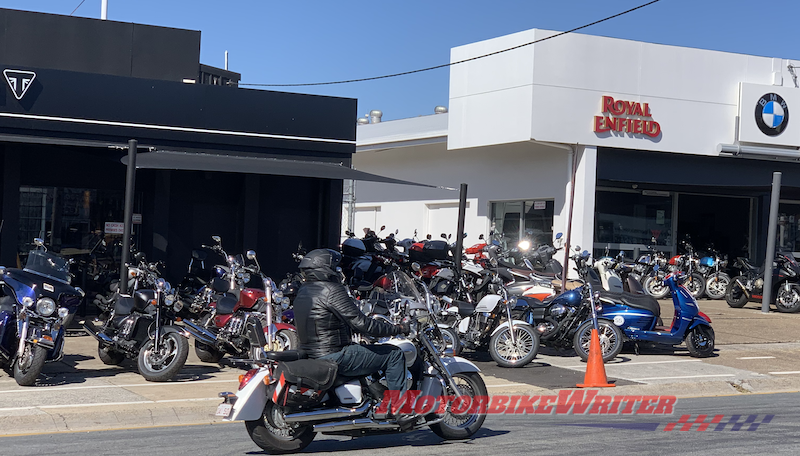
So it seems there are plenty of people out there getting on motorcycles or buying second and third bikes.
“This steady growth of 8.3% over the same period in 2020 shows us that there is strong demand from buyers who want to use a motorcycle as their first choice for the daily commute and for recreation,” says FCAI boss Tony Weber.
Road bikes were up just 2.2% to 26,119, off-road motorcycles were up 10.5% to 35,120, OHVs up 14.1% to 21,590 and scooters up 1.5% to 3410 units.
However, the official FCAI figures don’t necessarily mean a lot these days.
The supposed “peak body for the automotive industry in Australia” now represents a dwindling number of importers who pay to be members.
While several manufacturers who are not members may be minor players, CFMoto is not included and it is most likely in the top 10 sellers in Australia.
Plus scooter sales are possibly much higher than the announced 1.5% increase as most scooters sold are 50cc models from Asian manufacturers who are not FCAI members and therefore not included in the figures.
The figures now only provide the breakdown in classes (road, off-road, OHV and scooters) and do not include the top 10 sellers in each category such as sports bikes, enduro, tourers, cruisers, learners, etc.
So riders now have no idea how their brand, model and category is performing which used to be a good indicator of resale value.
The figures used to include a list of the top sellers by manufacturer, but now riders have no indication of which manufacturers might be desperate for sales and offer discounts.
FCAI boss Tony Weber says the increase is “significant and signals improving conditions for both members and dealers”.
Tony Weber
However, there is concern among dealers that the boost was in some part due to customers buying their dream bike with superannuation funds and that the end of the financial stimulus Jobkeeper payments in September could lead to another downturn.
The biggest rises during the quarter were in ATVs which jumped 50.9% to 14,545 and off-road bikes which were up 42.4% to 20,885.
Tony believes their success is due to people holidaying at home instead of overseas and the government’s instant asset write-off program which makes the purchase of farm machinery and equipment attractive.
What’s next?
However, it is of concern that expensive and high-profit-margin road bikes were down 2.7% to 15,243, while scooters were also down 12.8% to 2166.
That’s on the back of a 7.8% decrease in road bike sales in the first quarter and a 14.1% drop in scooter sales.
Honda claimed the top spot in the June quarter, with 12,563 sales for a 23.8% market share, followed by Yamaha with 12,344 (23.4%), Kawasaki 6545 (12.4%), KTM 4391 (8.3%) and Suzuki with 3594 (6.8%).
Australian motorcycle sales took another 8.1% dive in the third quarter which contributes to a 33-month downturn in the industry.
By comparison, car sales are down 7.9% last month which is the 18th month in a row of decline, according to official data released by the Federal Chamber of Automotive Industries (FCAI).
FCAI boss, Toby Weber, who is learning to ride a motorcycle, says the bike and car sales decline is “in line with the broader economic environment in Australia”.
“We have seen many factors, including multiple weather events, Federal and State elections, and tightened lending practices contribute to the overall economic conditions,” he says.
In the nine months this year, 62,898 motorcycles, ATVs and scooters were sold, compared with 68,460 for the same period in 2018.
Honda was the overall leader with a 23.1% share of the national market, followed by Yamaha with 21% and Kawasaki with 10.6%.
Road bikes dive
The biggest drop was in road bikes, which took a 13.8% dive.
Harley-Davidson was the road bike leader again with a 19.6% share, while Honda had 16.8% and Yamaha 16.6%.
Honda used to lead this segment, but as been hit by Australia Post not buying postie bikes, but converting to three-wheeler electric bikes.
Australia Post postie bike electric trike eDV
Across the industry segments, Scooters defied the trend, with a 14.5% climb in sales during the first three quarters.
Honda held a 39.9% scooter share, followed by Vespa with 14.8% and Piaggio with 14.2%.
The ATV/SSV took a 11.3% dive with Polaris the leader on 28.1% share, followed by Honda 22.5% and Yamaha 19.3%.
Off-road category sales fell 2.4%, led by Yamaha 28.1% share, Honda 27.4% and KTM 18.8%.
Motorcycle sales are continuing their slide and even picking up pace with a 14.6% drop in the first quarter of 2019.
It’s the biggest quarterly drop since the slide began in 2017 and cause for concern.
Some of the sales decline could be due to the uncertainty in the economy owing to the impending Federal Election.
According to data released today by the Federal Chamber of Automotive Industries (FCAI), 18,438 motorcycles, ATVs and scooters were sold during the first three months of 2019.
That compares with 21,599 for the same period in 2018 when sales were down 13.4% on the previous year. Sales results for the full year of 2018 were down 8.7%.
All categories were affected by the tumbling pace of sales except scooters which were up 29.6% from a low base eroded over the past few years.
Pace leaders and losers
Honda was the overall leader with a 21.8% share of the national market, but a 17.4% drop in sales.
Yamaha was second with a 20.8% share (down 8.4% in sales) and Kawasaki with 11.8% (-6.8%).
Road motorcycles fell 19.2% as Harley-Davidson returned to the lead again with a 19.1% share even though Harley sales continued to plummet 17.8%.
Yamaha was second with 18.2% (down 8% in sales) and Honda with a share of 16.6%, but down a whopping 37.9%.